
What’s My Business Worth? – Part IV
This is Part IV in a series devoted to taking the mystery out of business valuation. In previous episodes, we covered some of the basic concepts of business valuation, and the three basic approaches to business valuation analysis. Then we introduced the concept of present value, and how to use discounting to value future cash flows. In this episode, we introduce the concept of financial statement analysis.
This presentation contains general information about the valuation process, however it is not intended to give you advice about your own particular situation. You should always consult with your own advisors and should engage a qualified professional to assist in any valuation assessment.
You can watch our latest video presentation or read on your own below.
Table of Contents
Basis of Accounting
Levels of Assurance
Financial Statements
Ratio Analysis
What do we mean by Financial Statement Analysis?
So what do we mean by financial statement analysis? A company’s financial statements can tell us a lot about what is going on in the business. Beyond just looking at net income, we can get a feel for how effectively the company is using its assets. Is its capital structure optimal for the business? We can evaluate some of the financial risks that the company faces, and dig a bit deeper into profitability.
The better we understand a company’s financial statements, the more confidence we can have in future results. As an investor or buyer of the business, reducing uncertainty can give us confidence in making the investment or purchase.
Basis of Accounting
Before we can begin to analyze a company’s financial statements, we need to know the environment in which they were prepared. Financial statements of publicly traded companies in the U.S. must be audited by an independent public accountant, and must comply with the requirements of generally accepted accounting principles (GAAP) along with the rules and regulations of the Securities and Exchange Commission (SEC). Privately owned companies, however, have much more flexibility.
We need to know what basis of accounting was used in preparing the financial statements. Generally accepted accounting principles, often called GAPP, is the preferred basis of accounting. Preparing financial statements under GAPP will ensure that the financials are comparable from period to period, as well as to other companies. GAPP also requires comprehensive disclosure, via the footnotes, of information useful for understanding the financial statements.
Sometimes, we will see financial statements prepared on another basis. The income tax basis is fairly common for smaller privately-held companies. Some other bases could be Government GAPP, or International Financial Reporting Standards. Sometimes smaller entities will use the cash method of accounting. Under the cash method of accounting, sales are booked when cash is received. So if a sale was made on credit, we wouldn’t record it as a sale until the customer paid the invoice. Similarly, expenses are not recorded until they are actually paid.
Most importantly, we need to know whether the chosen accounting rules have been applied consistently for all statements. If the accounting is inconsistent, then our ability to learn anything from the financial statements is seriously limited.
Levels of Assurance
Let’s take a minute to talk about what levels of assurance we might seek for financial information. The lowest level of assurance would be financial statements internally prepared by the company, with no outside oversight. While the financial statements may, in fact, be perfect, we would want to spend some time asking questions and looking at documentation to assure ourselves that the data is reliable. It would be advisable to seek expert advice here.
The next level would be financial statements compiled by an accountant. In a compilation engagement, the accountant would compile a company’s financial statements from the company’s own records. The accountant would make inquiries of management, but would not perform any significant testing or analysis. The accountant would offer no assurance that there are no material misstatements or errors. The accountant would issue a written report to accompany the financial statements.
The next level would be having the financial statements reviewed by an independent accountant. In a review, the accountant would perform some limited testing and analysis, and would give limited assurance, in his written report, that the financial statements are presented under the requirements of the chosen basis of accounting.
The highest, and most expensive, form of assurance would be an audit. The auditor would express an opinion giving reasonable assurance that the financial statements are fairly presented under the requirements of the chosen basis of accounting. Due to the expense involved, audited financial statements are unusual for smaller privately-held companies.
Financial Statements
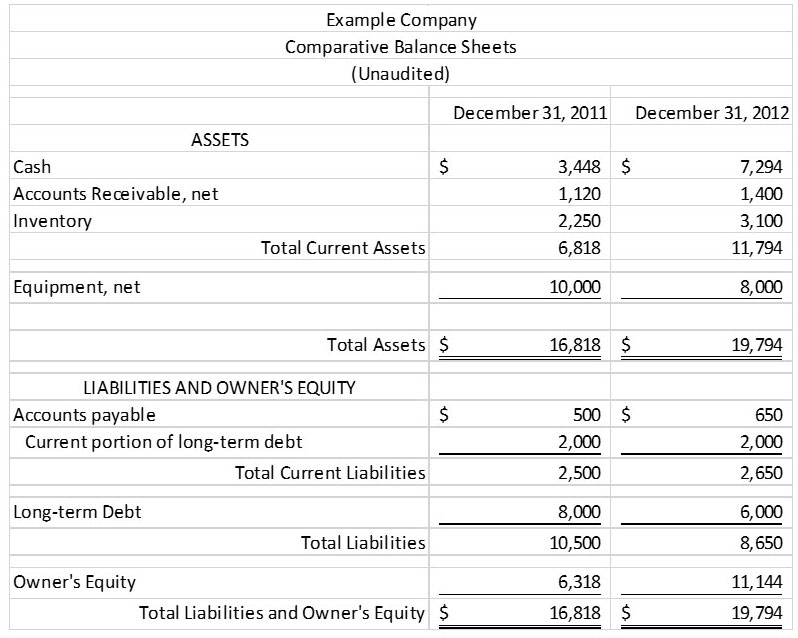
The Balance Sheet
The Balance Sheet, or Statement of Financial Position, lists a company’s assets and liabilities, categorized. Assets are the resources of the company, and can include items such as cash, inventory, land, buildings and equipment. The other side of the balance sheet describes how the assets are financed: liabilities represent amounts borrowed from others, and owner’s equity the amounts invested by the owners. Generally, items are stated at historical cost, or at lower of cost or market values. We would have to read the notes to the financial statements to tell whether the company used any “mark to market” accounting.
Current assets are assets that will be consumed within one business cycle, typically one year. Current liabilities are obligations that must be satisfied within the same business cycle period. For the rest of this discussion, we will assume that the business cycle is one year. Current assets and current liabilities are often referred to as working capital, and current assets minus current liabilities as net working capital.
Fixed Assets other than land are depreciated. That is, a portion of its acquisition cost is written-off to expense each year.
We’ll refer to the example balance sheet, below, throughout our discussion of analysis techniques.
The Income Statement
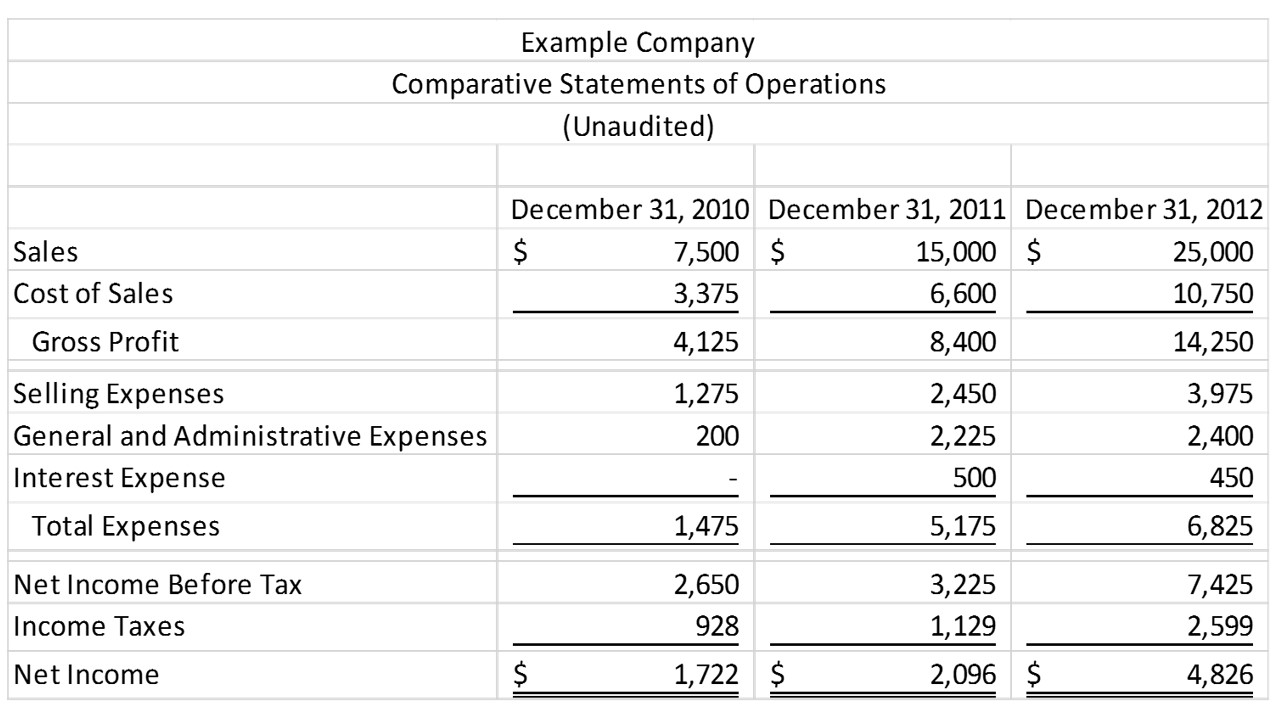
The income statement, or statement of earnings, tells us about the company’s revenues and expenses, measured and recorded according to the adopted accounting rules. Income statements can be for any period of time: a month, a quarter or a year. You will recall from our earlier discussions that net income is not the same thing as cash flow, it includes non-cash charges like depreciation expense. Our example, below, is a comparative income statement for three years. We’ll refer to it throughout our discussion of analytical techniques.
Statement of Cash Flows
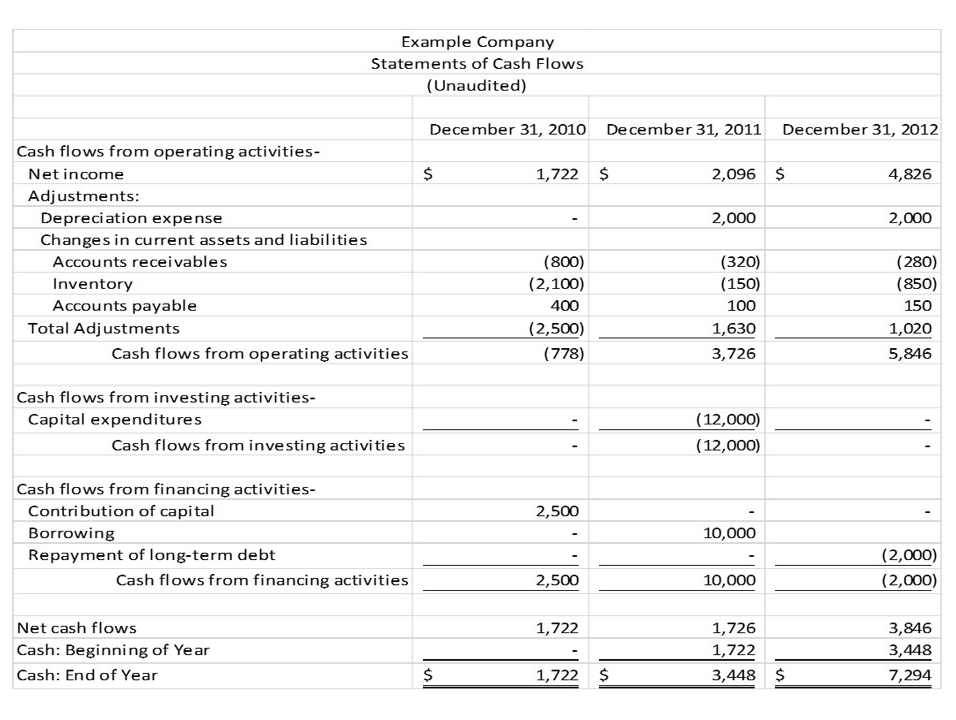
The Statement of Cash Flows is probably the least understood, yet potentially most useful of the statements. In the top portion, operating activities, we see the effect on cash of variations in working capital items. If accounts receivable increased, for example, it means that some of the sales we reported on the income statement (included in net income) have not yet been collected in cash.
Cash flows from investing activities will show us when the company had capital expenditures, for example buying equipment. Looking at the example, below, we can see that this company bought $12,000 in equipment during year 2011, and up in operating activities we see $2,000 in depreciation expense during the year. This corresponds with the $10,000 in equipment reported on the balance sheet at year-end 2011 ($12,000 purchase less $2,000 depreciation).
Cash flows from financing activities shows us the effect on cash of changes to the capital accounts of the business: specifically long-term debt and owner’s equity. We see that the owner put $2,500 into the business in year 2010, and borrowed $10,000 during 2011, with $2,000 repaid during 2012.
Notes to the Financial Statements
The notes to the financial statements, sometimes called the footnotes, are an integral part of the financial statements. They will always be present in audited financial statements, but may sometimes be omitted, or highly condensed in unaudited statements. If present, they should be read carefully. In the notes, we will find the significant accounting policies of the enterprise, along with detailed disclosures of leases, long-term debt and other obligations, and fixed assets.
Ratio Analysis
Up to now, we’ve covered the financial statements, and talked about determining the basis of accounting used to prepare them. Now let’s look at some analytical techniques used to draw inferences about a company from its financial statements.
One of the most powerful tools to analyze financial data is ratio analysis. A ratio is just one number divided by another. It’s a way to compare results on a common basis. Probably the most familiar ratio we encounter is miles per gallon as a measure of fuel economy. If we were comparing two vehicles, and were told that vehicle #1 used 10 gallons to travel 200 miles and vehicle #2 used 5 gallons to travel 120 miles, it isn’t obvious which is more efficient. Be if we instead use the ratio of 20 m.p.g. for vehicle #1 and 24 m.p.g. for vehicle #2 we have a way to compare them. Ratios serve the same purpose in finance: they provide a way to compare different companies using a common measure.
Liquidity
Probably the biggest risk a company faces is running out of cash. Cash, and other assets that can be quickly converted to cash (such as accounts receivable) are collectively referred to as liquid assets. Liquidity ratios are a way to estimate the risk of a company being unable to meet its obligations over the next year. Liquidity ratios not only give us insight into the company under analysis, but can be compared with benchmarks and/or other companies.
The Current Ratio is defined as the company’s current assets divided by its current liabilities. You can think of it as an answer to the question, do I have enough liquid assets to satisfy all of the obligations that would come due in the next year. As a rule of thumb this ratio should be greater than 1:1, although there are exceptions. Referring back to the balance sheet of our example company, we calculate the current ratio for year 2012 as $11,794 / $2,650 = 4.5
The Acid Test ratio is a bit more conservative. It says, let’s assume that our accounts receivable and inventory are worthless, do we still have enough cash to pay all of our current liabilities. Again, this company is very liquid. In 2012, the acid test ratio was $7,294 / $2,650 = 2.75
Liquidity should be evaluated in relative terms. While being highly liquid is safe, it could also indicate that cash and other assets are not being invested in a productive way. We have to look at high liquidity in relation to the strategic plan of the company: is it planning an expansion or being defensive against a new competitor, or is it overly cautious.
Accounts Receivable Ratios
Accounts receivable levels are an important indicator of the quality of the company’s customer base. A company may have high reported sales, but if it has trouble collecting payment it could eventually have a cash shortage.
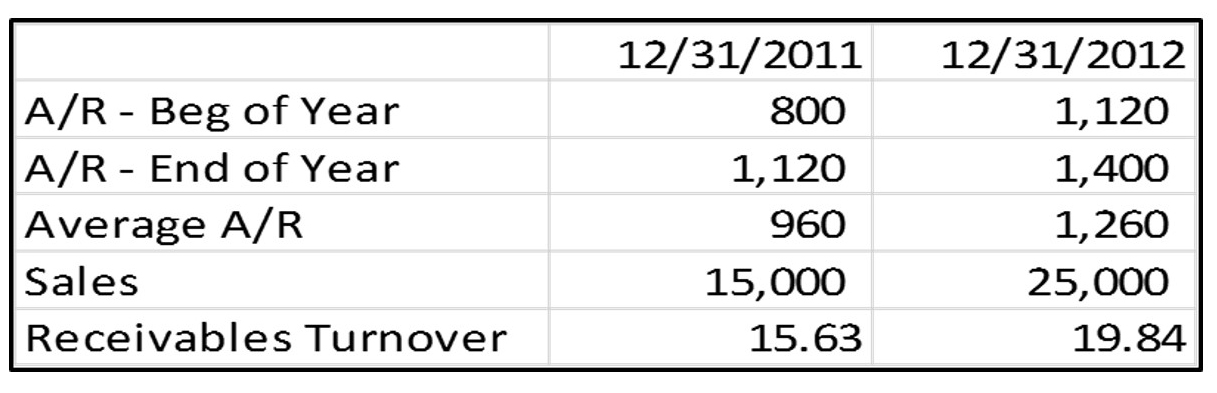
Accounts Receivable turnover ratio
The turnover ratio tells us how many times the receivable balance was “turned-over”, that is a sale made and collected, during the year. For example, if a company sold products on 30 day terms, we would expect a turnover ratio of 12 (365 days per year divided by 30 days terms). Looking at our example company we can see that turnover is improving.
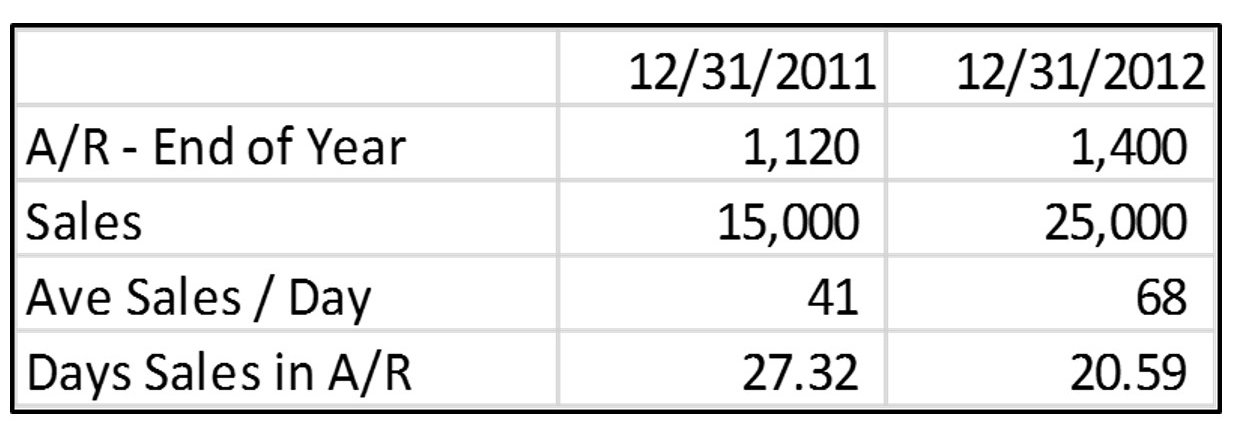
Days sales in Receivables
Days Sales in receivables tells us how many days of sales are uncollected at the balance sheet date. It is simply the ending accounts receivable balance divided by the average daily sale. If, upon inquiry, we discover that this company’s credit policy is to sell on 10 day terms, it would appear that it has a collection problem. If credit terms are generally 30 days, then it appears collections are going very well. The ratios have to be analyzed in context.
Inventories
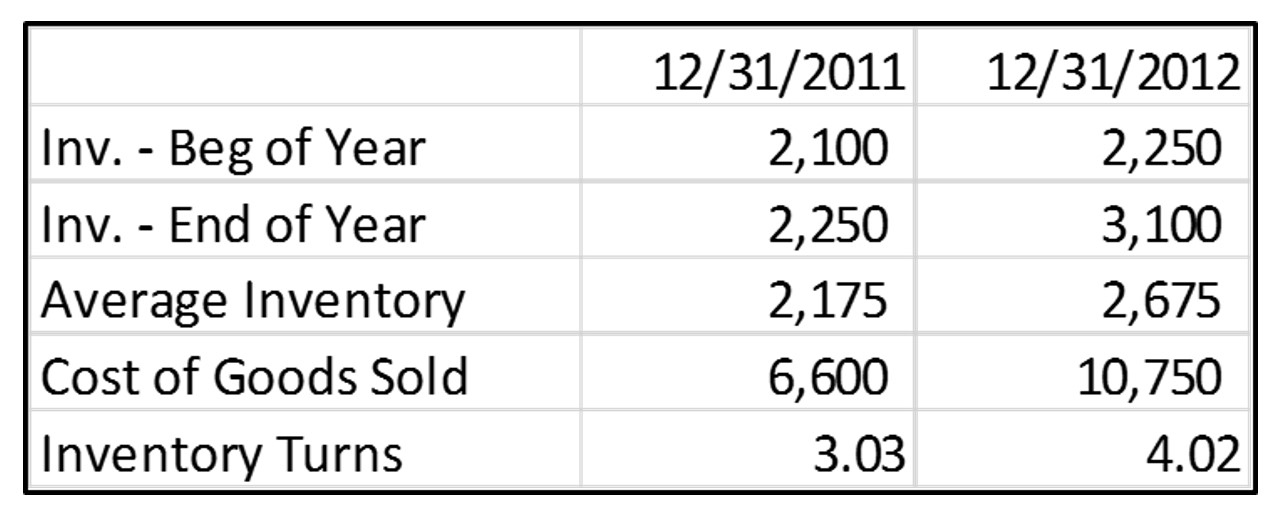
Inventory Turnover Ratio
Inventory is often a material item on a company’s balance sheet. A significant risk is that obsolete or unsalable inventory is allowed to accumulate instead of being marked-down or written-off. Inventory turns, that is the cost of goods sold over a year divided by average inventory, gives us a feel for how long the inventory has been around. Note the similarity with accounts receivable turnover, however we use cost of goods sold as the denominator as inventories are stated on the balance sheet at cost.
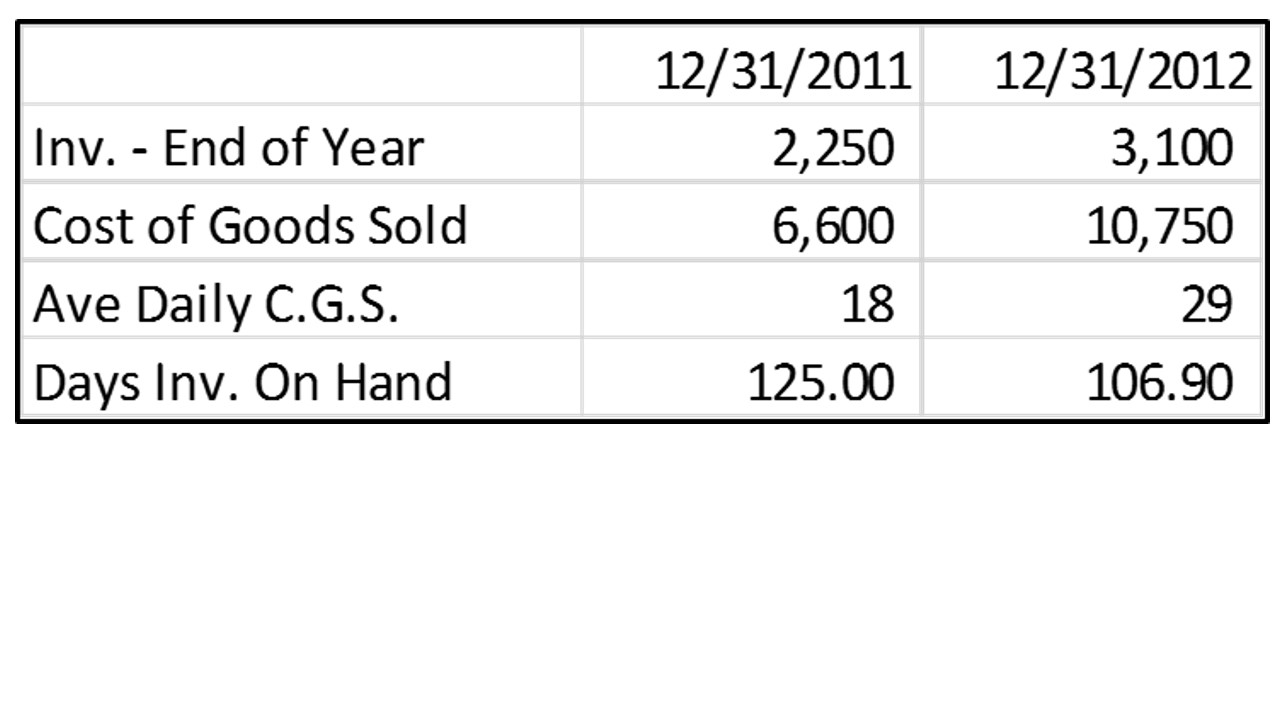 Similar to the days sales in receivable, days of inventory on hand is a way to evaluate inventory on hand in relation to the company’s sales. In our example company, we can see that at year-end 2012, at our current average daily sales, it would take us over 3 months to sell all of our inventory.
This seems like a lot of inventory, though it could be peculiar to the industry we are in, or be seasonal. We would probably want to focus on inventories a bit more if we were considering buying this company.
Coverage Ratios
Coverage ratios give us a way to compare earnings to the obligations of the company. They give us some perspective on the risk of financial leverage.
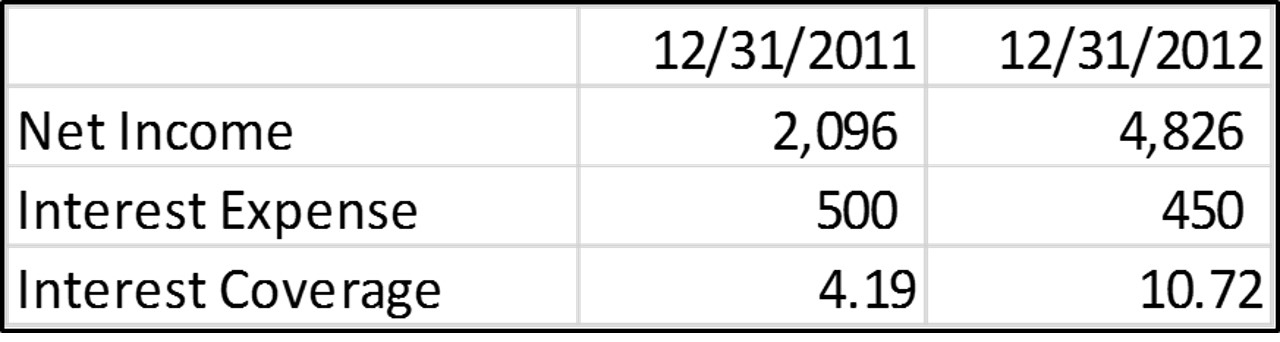
Interest Coverage Ratio
Interest Coverage Ratio, defined as net income divided by interest expense, helps us understand how much leeway there is before a company would be unable to meet its interest obligations. Lenders, in particular, are very interested (no pun intended) in interest coverage ratios. If we are contemplating buying a company with debt financing we would need to have some comfort on interest coverage.
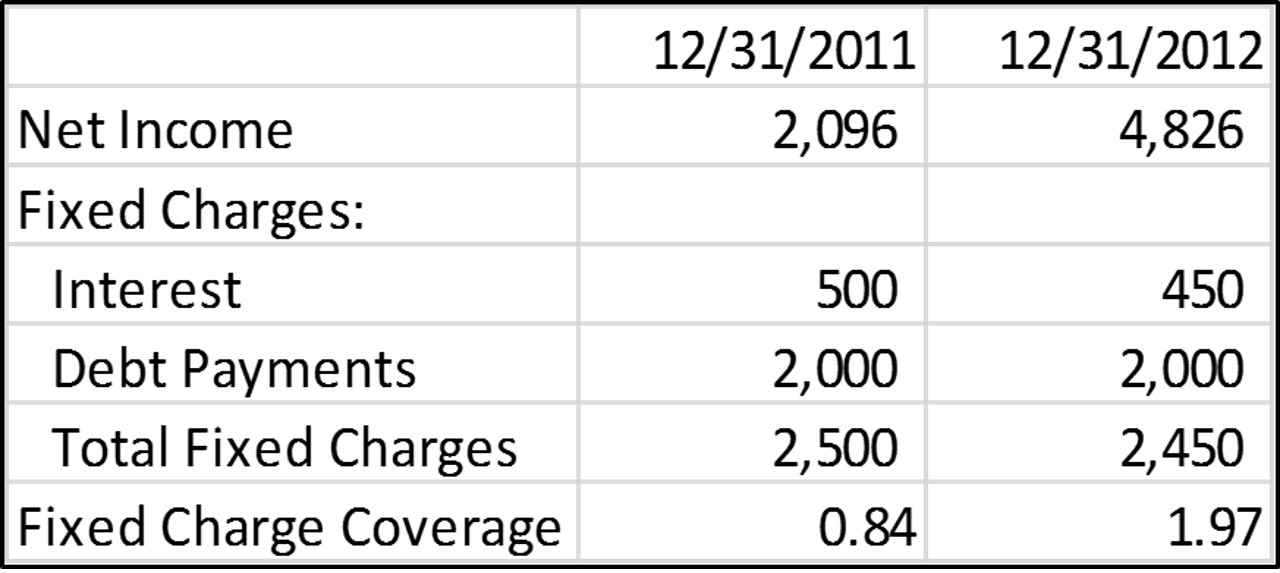
Fixed Charge Coverage Ratio
The fixed charge coverage ratio is a bit more conservative, it uses all fixed charges, such as interest payments, debt repayments, leases, etc. as the denominator. Our example company has shown significant improvement in 2012 compared to the prior year. Fixed charge coverage ideally should be greater then 1.0 in most circumstances.
Profitability Ratios
Profitability ratios give us perspective on how much of a particular activity “falls to the bottom line”, that is how much results in profit.
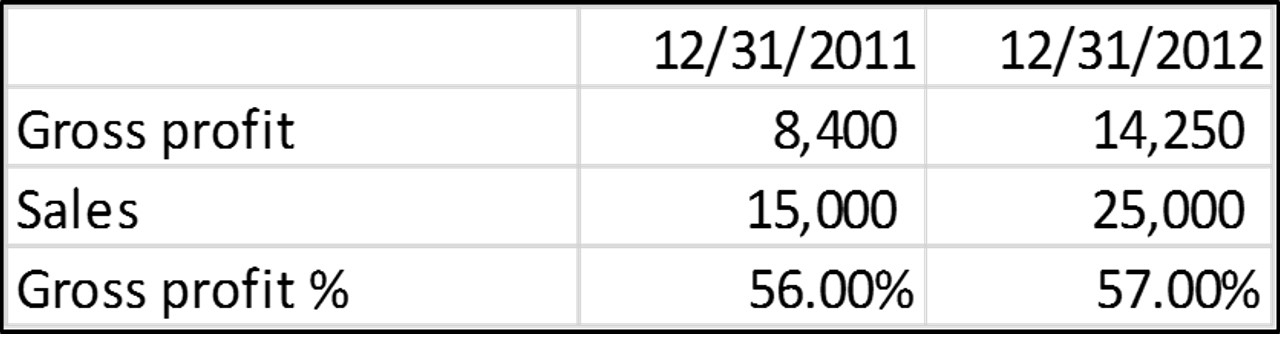
Gross Margin
Gross profit is a way to measure a company’s sales pricing compared with its cost of product. Gross profit is the difference between sales and cost of goods sold. If we divide gross profit by sales we call the result the gross profit percentage, sometimes referred to as gross margin. In our example above, 57% of each sales dollar was available to pay expenses in 2012.
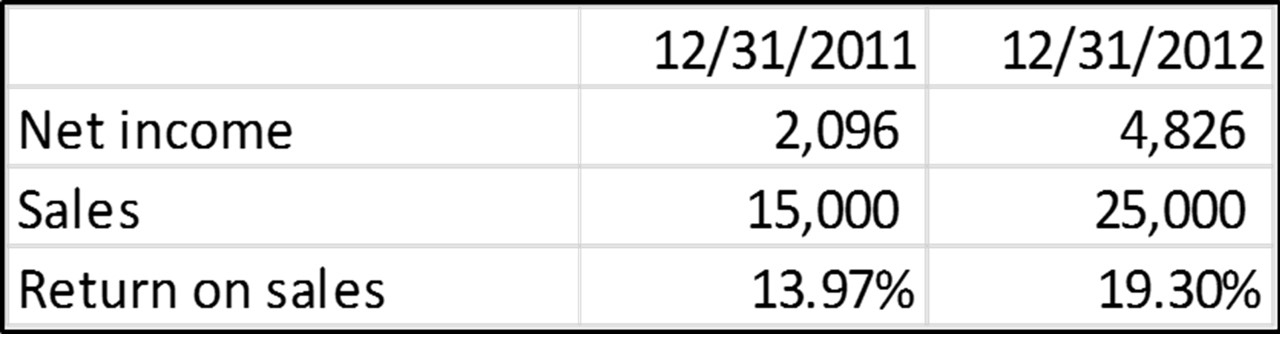
Return on Sales
Return on sales relates sales to net income, it is simply net income divided by sales. In 2012, we can see that just over 19% of each sales dollar was profit. This is an extraordinary result for most businesses. To be useful, though, we would need to compare these results with other companies in the same industry.
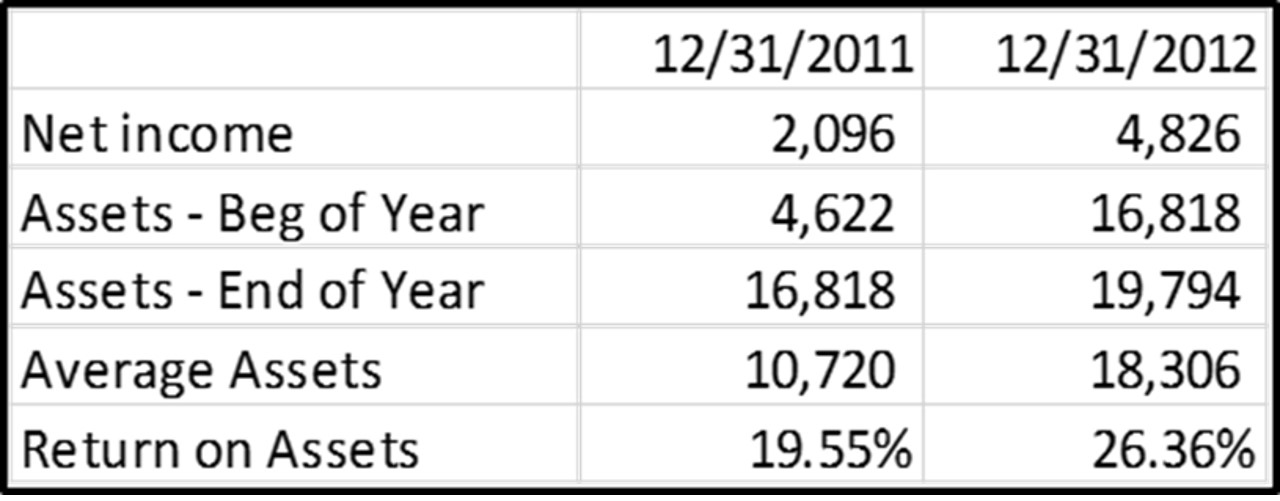
Return on Assets
Another way to look at profitability is to relate it to either assets, or to the equity capital invested in the business. Return on assets, net income divided by average total assets, is often used to evaluate whether or not the company is productively using its assets. A low return on assets with an otherwise acceptable return on sales, for example, could lead us to investigate whether or not there were underutilized assets in the business that could be sold or invested elsewhere.
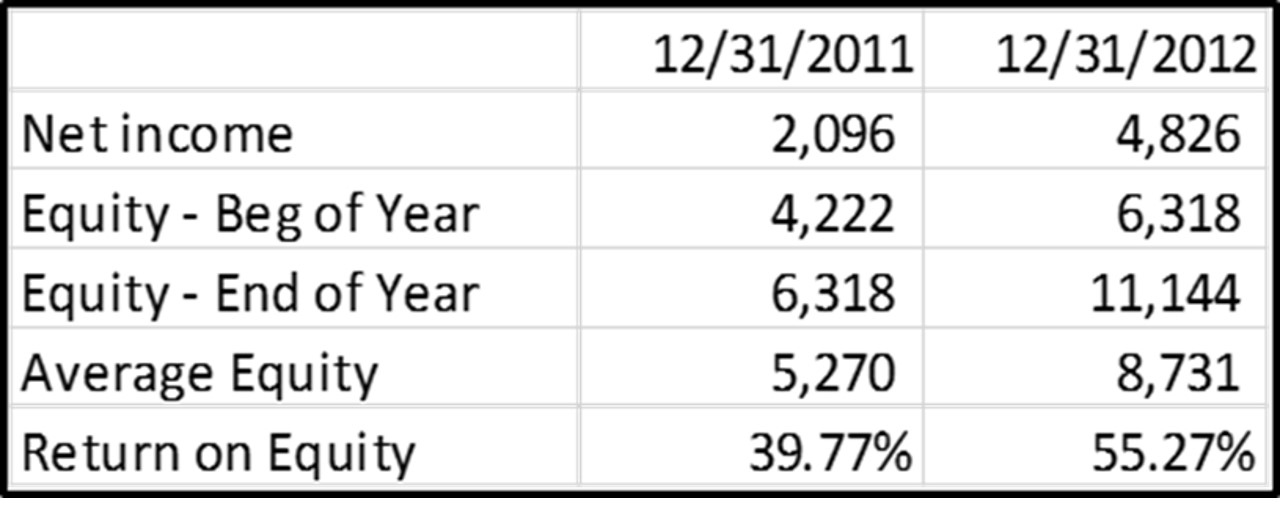
Return on Equity
Return on Equity, sometimes called return on investment, is the company’s net income divided by the equity capital invested. In our example company above, the owner earned a 55% return on investment in this business. Return on equity should be considered in light of the company’s financial leverage, as we will see in a minute.
Financial Leverage
We’ve used the term financial leverage, let’s define it. First we need to define the term capital structure. Capital refers to the funds invested in a business to pay for its assets. Capital is typically comprised of debt and equity. Leverage refers to the relative amounts of debt and equity in the capital structure.
Like a conventional lever, we can magnify the results achieved by moving one side of the lever. Think of a see-saw, if the see-saw is evenly balanced then we can say there is zero leverage. A child on one side would remain forever in the air if an adult were on the other side. But if we unbalance the see-saw, that is, increase leverage, then the child on the long side can balance the adult on the short side.
It works the same way in finance. As we borrow more money, we need to invest less of our own money in the business. Note that leverage works both ways, however. It can magnify profits but it can also magnify losses, hence the risk.
Capitalization Ratios
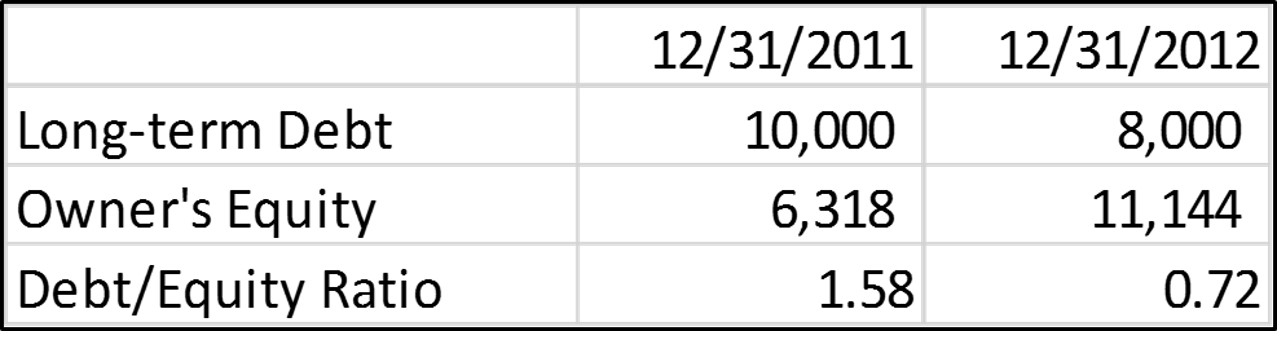
Debt/Equity Ratio
The debt/equity ratio is a way to assess financial leverage. It is simply the company’s debt capital divided by its equity capital. If a company had no debt, its debt/equity ratio would be zero, and if it was financed equally with debt and equity its debt/equity ratio would be 1.0.
From our example balance sheets we can see that our company has been deleveraging during 2012, that is its debt/equity ratio has declined as it has repaid some debt, and its equity increased from earnings.
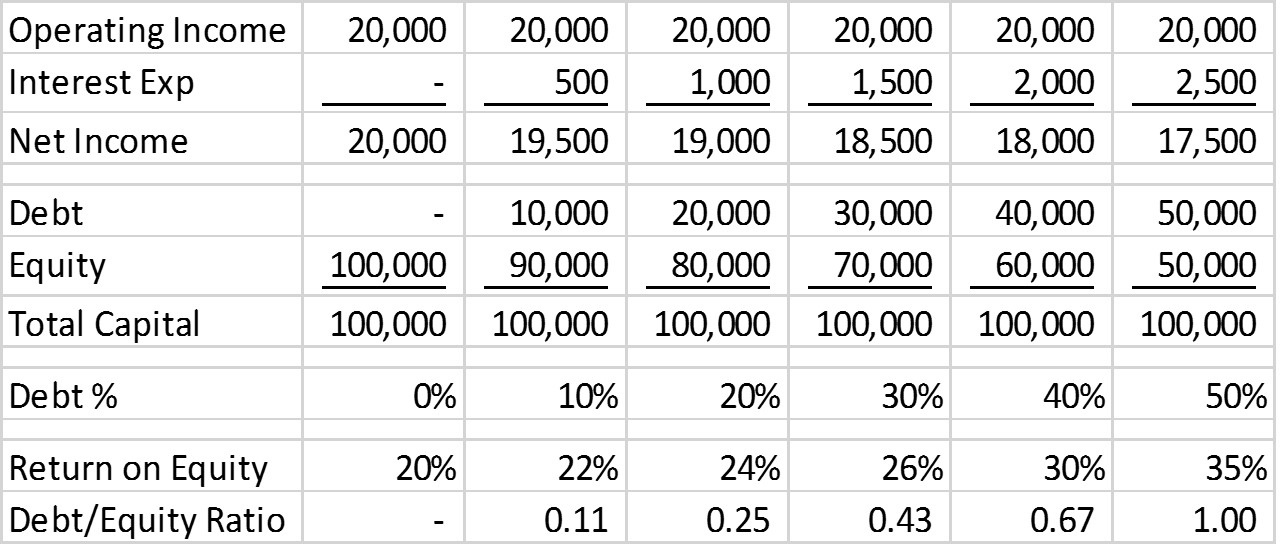
Effect of varying leverage on return on equity
Here is an example of financial leverage. For this example, I assumed a company earns $20,000 before interest expense and has total capital of $100,000. With zero debt, the owner earns 20% on a $100,000 investment. As we increase debt, our net income declines (due to interest expense, which I assumed to be 5%) but our return on equity increases. With a debt equity ratio of 1, for example, net income is down to $17,500, but the owner only has $50,000 invested, so she earned 35% on her investment.
Summary
Some final thoughts. Financial statement analysis can be a useful tool to reduce the risk of buying or investing in a business. Financial statement analysis gives us insight, but not necessarily definitive answers. Analysis can help us focus attention where needed, and give us some assurance as well.
Its use is predicated on having accurate, consistently prepared financial information. If we are a business owner, one way to increase the value of our business is to ensure that we have reliable, timely financial information.
Financial statement analysis is a tool that can be used by an investor in evaluating a prospective investment, and also by a company’s owner or manager to pinpoint issues that require further attention.
I hope this has been informative. In previous episodes, we discussed some of the basic concepts behind valuation analysis, some of the methodologies used, and paid particular attention to the concept of present value and discounted cash flows. In this episode we introduced some of the concepts of financial statement analysis.
Stay tuned, We’ll continue to offer presentations that I hope will be useful for you. If I can offer any assistance, please feel free to contact me. Visit us on the web, or on Facebook. I would love to hear your comments, and any suggested topics for the next program