Monthly Archives: July 2013

Discounted Cash Flows Analysis

What’s My Business Worth? – Part III

This is Part III in a series devoted to taking the mystery out of business valuation. In previous episodes, we covered some of the basic concepts of business valuation, and the three basic approaches to business valuation analysis. In this episode, we are going to look at how we use discounted cash flow analysis to estimate the value of a future stream of cash flows.

This presentation contains general information about the valuation process, however it is not intended to give you advice about your own particular situation. You should always consult with your own advisors and should engage a qualified professional to assist in any valuation assessment.

You can watch our latest video presentation or read on your own below.

Time Value of Money (Present Value)

Common sense tells us that cash to be received sometime in the future is worth less than cash in your hand today. Why? It’s all about risk. There is the risk that you will never realize the expected future cash flow. Remember Wimpy? “I’ll gladly pay you on Tuesday for a hamburger today.” Unfortunately, he never specified which Tuesday.  Realization of that cash flow could only be described as “iffy.”

Anyone who has ever had a variable rate loan has experienced interest rate risk. As we will see in a minute, bond investors accept interest rate risk when they buy a bond. The value of their investment will fluctuate with market interest rates.

Opportunity cost is a way of saying that we have alternative uses for our cash: we could invest it in this opportunity, in another, sit on it, or spend it.

Discounting is the mathematical technique we use to measure and account for risk.

Example – Bond Valuation

A treasury bond is the classic example of a financial instrument with zero credit risk. Whether or not that is still true is beyond the scope of our discussion today, but let’s assume that it is. Let’s say we could buy a bond today for $10,000 that will mature in one year and repay our investment plus 5% interest. How much will we receive?   We will receive our original principal plus the interest earned on our investment.  The interest earned is simply our investment amount ($10,000) times the interest rate (.05)

Some Key Definitions:

  • Future value(FV) – is the amount we expect to receive sometime in the future.
  • Present value(PV) – the amount we will invest today to receive the future value.
  • Discount rate(R) – the implicit interest rate that we use to calculate present value

On to the math:

Finance, like physics, is really a field of applied mathematics.   I’ll try to keep the math as simple as possible, no more than high school algebra.

As we saw on our bond example earlier, the future value is the present value plus interest earned over the period of investment.  Expressed as an equation, FV = PV + I, where I = the interest earned over the period of investment.  The amount of interest earned in one period is equal to the interest rate times the principal amount of the investment. I = PV X R.

Substituting the PV times R for I in the first equation, we get FV = PV + (PV * R) which we can simplify to FV = PV X (1+R).

From our example, investing $10,000 at 5% for one year we get 10,000 * 1.05 = 10,500.  Looking at it the other way, the right to receive $10,500 in one year is worth $10,000 today.

Compounding Interest

Suppose we invested $10,000 earning 5% for 2 years?  Here we see the effect of compounding.

At the end of year 1, we have FV = PV X (1+R), which we re-invest for another year.  At the end of year two we would have earned interest on our re-investment amount giving us: (PV X (1+R)) X (1+R).

We can generalize the equation for compounding as follows: FV = PV X (1+R)^n where n is the number of compounding periods.  Dividing both sides of the equation by (1+r)^n, we solve for present value: PV = FV / (1+R)^n.

Using our treasury bond example, we expect to receive $11,025 in two years. The market interest rate is 5%, that is we would expect to receive 5% on a different investment with the same risk over the same term. Going through the calculation, you can see that the present value is our original $10,000.

  •  PV = FV / (1+R)^n where FV = $11,025, R = 0.05 and n = 2
  • PV = (11,025) / (1.05 X 1.05)
  • PV = 11025 / 1.025
  • PV = $10,000

Interest Risk Illustrated

Now let’s suppose we are looking at a bond that was sold with a coupon rate of 5% which will pay $11,025 in two years, but in today’s market similar investments are earning 6%. How much is this bond worth?

We perform the same calculation as before, using a 6% discount rate

  •  PV = FV / (1+R)^n where FV = $11,025, R = 0.06 and n = 2
  • PV = (11,025) / (1.06 X 1.06)
  • PV = 11025 / 1.1236
  • PV = $9,812

and arrive at a present value of $9,812. This says we could invest $9,812 for 2 years at 6% and will have $11,025 at the end, the same as this bond. Remember when we mentioned interest rate risk earlier? This is an example of interest rate risk. If we had paid $10,000 for this bond earlier, and wanted to sell it now it is only worth $9,812, the difference ($188) is due to interest rate fluctuations.

Selecting a Discount Rate

The choice of a discount rate is similar to the analysis we went through in the last program to select an earnings multiple.  It involves assessing operating risk, that is how much uncertainty surrounds earnings forecasts.  It also involves macroeconomic forecasts of future interest rates, and comparing with expected returns associated with alternative uses of investment funds.

There are a number of factors to consider in evaluating operational risk.  Let’s take a look at a few of them:

Revenues: Obviously revenues, or sales, is important, as revenues are the source of profits. Level of revenues is important, but we should also consider trends in revenues: is it growing year over year, stagnant, or declining? How does this company’s revenue levels compare with other, similar companies?

Predictability of Revenues: How likely is it that future revenues can be estimated based upon past revenue levels? If a company relies on a few, major customers, it is much riskier than a company that has a large, diverse customer base. The loss of even one major customer could change a profitable company into a loser. Repeat business, or business coming from referrals of past customers is an indicator of customer satisfaction with the company and its products or services. Looking at accounts receivable collection history can give us a perspective on the quality of customers. High bad-debt write-offs indicate a high-risk customer base. After all, a sale is only a sale when cash is received.

Earnings: When someone buys or invests in a business, what they really are buying is the future stream of cash flows or profits. We should look at profit margins, return on sales and return on investment, to evaluate the business performance and compare it with its peers. What are the trends in profits? A consistent trend of increasing profits would justify a lower discount rate than a level or declining profit trend.

Competitive Environment:  Understanding the competitive environment is critical to evaluating the risk to the company’s profit trend. How likely is it that a new competitor will enter the market? Are there any barriers to entry that would make it more difficult for a new competitor. Is there something unique about the business being evaluated. How does the company position its products or services? Is it a premium product, or a discount brand?

Reliance on the Owner: Does the company have written procedures and processes, or are they carried around in the owner’s head? Are customers and suppliers loyal to their relationship with the owner, or to the company’s products and services. Is there a management team in place to operate the business in the owner’s absence. Could a buyer expect that the owner will be cooperative during the transition? In a sale, is the owner willing to partially finance the deal?

Discounted Cash Flow Method:

There are four major steps in performing a discounted cash flow analysis:

  1. First we project future earnings, typically over 5 years but it could be longer or shorter.
  2. Estimate a selling price for the business at the end of the projection timeline.
  3. Determine an appropriate discount rate. The discount rate represents a risk-adjusted opportunity cost of capital for a prospective buyer or investor.
  4. Calculate the present value of the projected cash flow stream.

 Example Discounted Cash Flow Analysis

Figure 1

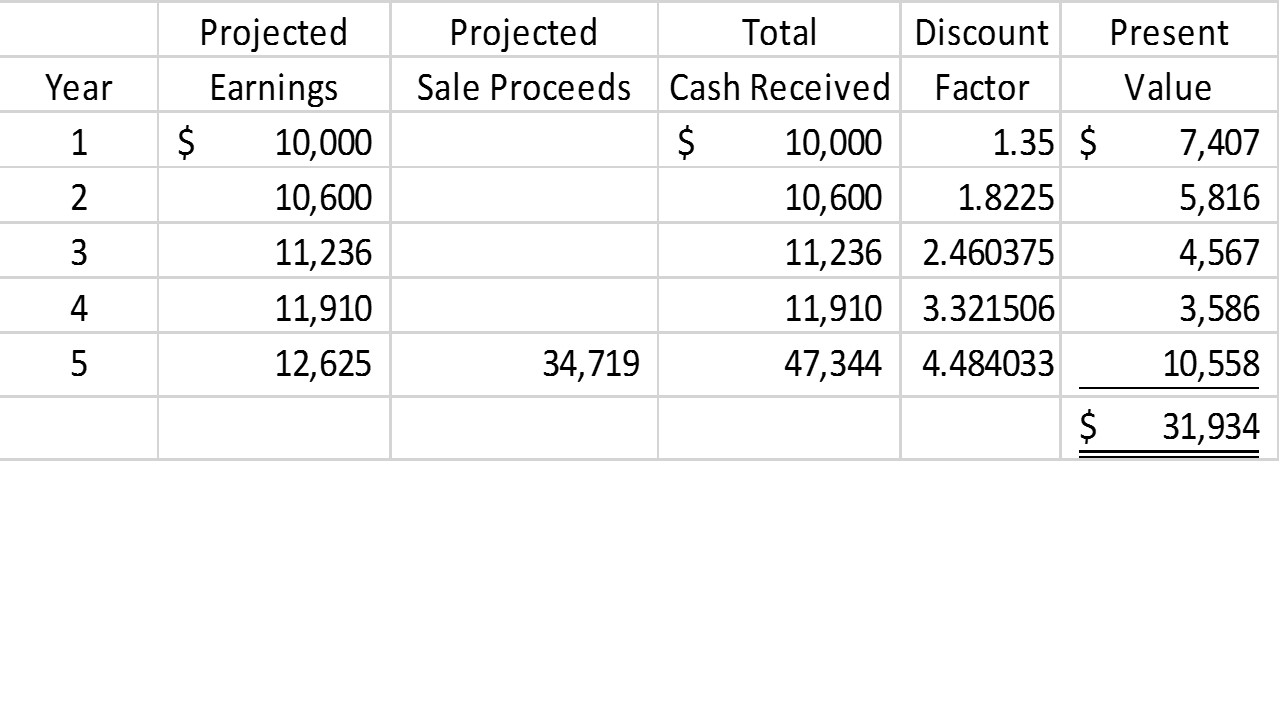
Let’s perform the four steps based on the data in Figure 1 above:

  1. We’ve prepared a five-year projection of earnings for our example company. In the first year, we expect $10,000, and we expect earnings to grow by 6% per year thereafter.
  2. Based upon forecasted year 5 earnings, we expect to sell the company at the end of year 5 for $34,719. The total cash received column is simply the yearly earnings added to the proceeds of sale.
  3. We have chosen a discount rate of 35%. As we discussed in our previous article, investment in a small business is significantly more risky than investing in the stock market, bond market, or real estate. The 35% is based on our best estimate for risks associated with the projected future cash flows.
  4. We then divide each year’s cash receipt by the discount rate to get the present value of that year’s cash flow. Note in year 2, the discount rate is 1.035 X 1.035.

We sum up the present values and arrive at a valuation estimate of  $31,934.

Summary

To summarize, expected cash flow in the future is less valuable than cash-in-hand today. We use discounting as a technique to estimate the value of expected future cash flows.  In the discounted cash flow method, we estimate future cash flows, and discount using a risk-adjusted discount rate to arrive at the present value.

I hope this has been informative.  In the next installment, we’ll cover financial statement analysis.  Then we’ll put it all together with a valuation analysis of an example company.

Cypress Business Partners offers a free estimate of the value of your business.  Please let us know how we can be of service to you.   Visit us on the web, or on Facebook.   If you would like to be informed when the next presentation is available, please send me your email address.  I promise to respect your privacy and will never share your information with anyone.

The Earnings Approach to Valuation

What’s My Business Worth? – Part II

This is Part II in a series devoted to taking the mystery out of business valuation. In our last installment, we talked about the 3 general approaches to estimating value: the asset approach, the market approach and the earnings approach. In this episode we will dig a little deeper into the earnings approach. The earnings or cash flow approach develops a financial model to estimate value. The underlying theory here is that the assets of the business, in total, are in place for the purpose of generating cash flow. Their collective value can be determined by looking at cash flow levels generated by those assets. We then ask, what a willing buyer would pay to take control over a stream of cash flows.

This presentation contains general information about the valuation process, however it is not intended to give you advice about your own particular situation. You should always consult with your own advisors and should engage a qualified professional to assist in any valuation assessment.

Net income is not the same thing as cash flow.

A Company’s net income is reported according to generally accepted accounting principles, and is not the same thing as cash flow. Net income reflects expenses, such as depreciation, that are non-cash: they represent a way to spread the recognition of a cash expenditure over a number of years. Net income is also dependent on the company’s capital structure. If a company has debt there will be interest expense. The form of organization dictates whether or not the entity has a provision for income taxes. If the company is organized as a “C” corporation under the tax code, there will be a provision for tax, whereas if the company is an “S” corporation or a partnership, the company does not pay tax: its taxable income flows-through the company onto the individual tax returns of its owners. The form of organization and capital structure of a company are based on what was most advantageous to its current owner.

If we are a prospective buyer of a company’s assets, we don’t care how the current owner organized his company, or how its assets were financed. We will make our own decisions regarding form or organization as is most advantageous to us. We will choose whether to finance the company with all equity, equity and debt, or all debt (if we can find a lender willing to do that.)

Earnings before interest, taxes, depreciation and amortization (EBITDA) is a way of looking at a company’s earnings irrespective of its form of entity and capital structure.

Let’s look at an example:

Table showing effect of capital structure and form of organization on reported net income.

Effect of Capital Structure and Form of Organization on reported Net Income

• Company A is a C Corporation (under the tax code). It reports and pays income taxes on its taxable income. Company A is financed with equity, it has no debt on the balance sheet.

• Company B is also a C Corporation, but its capital includes some debt, so it has interest expense.

• Company C is an S Corporation – for tax purposes it is a flow through entity. It pays no taxes, taxes are recognized by the shareholders on their individual tax returns. Company C also has some debt and pays interest. Note that if Company C had no debt, its net income would be the same as its operating income: $2,000.

Notice that all three companies have identical operating income, but their net incomes are quite different. Net income isn’t particularly helpful for valuing these companies. It seems that each company’s assets should be worth the same, but they show very different net incomes. Net income is skewed by the organization and capital structures of the current owners of the assets. That’s where EBITDA comes in.

Table calculating EBITDA from three companies with different capital structures and forms of organization.

Figure 2. EBITDA and Net Income

 Depreciation expense is non-cash, so we will add it back in all cases. We also add back interest and taxes for reasons we’ve already discussed, and we notice that EBITDA for all 3 companies is identical, as we would expect.

Owner’s Discretionary Income

We’ve already covered EBITDA, but let’s look at Owner’s Discretionary Income. We identify items included in operating expense that are either paid to the owner, or are paid at the owner’s discretion. An example would be the owner’s salary or a company car for the owner. Our intent is to calculate the cash flow that would be available to a new owner, or investor, to be paid-out of the business or retained in the business at the new owner’s discretion.

We add these items back to EBITDA to get ODI.

In summary, ODI can be thought of as the operating cash flow of a business available to be used at the owner’s discretion, regardless of form of organization and capital structure.

Estimating the value of a stream of cash flows:

Now that we have defined cash flow as ODI, we are ready to assign a value to ODI.  A company employs assets to generate cash flows. The Earnings Method says that the fair market value of the assets can be estimated by measuring the company’s cash flows, and then assigning a value to those cash flows. To a buyer, the value of a stream of cash flows is highly dependent on how much risk is perceived in attaining future earnings from the purchased assets.

One common method of estimating fair market value is to multiply earnings, for example owner’s discretionary income, by a multiple. We might use average ODI over several years, or the most recent.

The choice of a multiple is critical to this method. Defining the multiple requires professional judgment to evaluate the risk of investment. At first glance, the multiple seems to be an arbitrary number. In fact, the multiple is subjective, but hardly arbitrary.

So how does this method even make sense? Let’s take a look at some of the most important factors that should be considered.

Defining a Multiple

How do we go about deciding on an appropriate multiple? The multiple is another way of saying how risky does a buyer or investor perceive the company to be? Every investment involves risk, an investor would require a higher return to compensate for higher levels of risk. So how do we evaluate risk?

There are a number of factors to consider here, let’s take a look at a few of them:

Revenues:

Obviously revenues, or sales, is important, as revenues are the source of profits. Level of revenues is important, but we should also consider trends in revenues: is it growing year over year, stagnant, or declining? How does this company’s revenue levels compare with other, similar companies?

Stability of Revenues:

How confident are we that future revenues can be estimated by looking at current and past revenue levels? If a company relies on a few, major customers, it is much riskier than a company that has a large, diverse customer base. The loss of even one major customer could change a profitable company into a loser. Repeat business, or business coming from referrals of past customers is an indicator of customer satisfaction with the company and its products or services. Looking at accounts receivable collection history can give us a perspective on the quality of customers. High bad-debt write-offs indicate a high-risk customer base. After all, a sale is only a sale when cash is received.

Earnings (Cash Flow): 

When someone buys or invests in a business, what they really are buying is the future stream of cash flows or profits. We should look at profit margins, return on sales and return on investment, to evaluate the business performance and compare it with its peers. What are the trends in profits? A consistent trend of increasing profits would justify a higher multiple than a level or declining profit trend.

 Competition:

Understanding the competitive environment is critical to evaluating the risk to the company’s profit trend. How likely is it that a new competitor will enter the market? Are there any barriers to entry that would make it more difficult for a new competitor? Is there something unique about the business being evaluated? How does the company position its products or services? Is it a premium product, or a discount brand?

 Reliance on Current Owner:

Graphical presentation showing earnings multiple and return on investment.

Figure 3. Earnings Multiple and Return on Investment

Yet another factor to consider when setting a multiple is how reliant the business is on its owner. Does the company have written procedures and processes, or are they carried around in the owner’s head? Are customers and suppliers loyal to their relationship with the owner, or to the company’s products and services? Is there a management team in place to operate the business in the owner’s absence? Could a buyer expect that the owner will be cooperative during the transition? In a sale, is the owner willing to sign a non-compete agreement, offer training and help with transition, or partially finance the deal?

This chart illustrates how multiple is really a surrogate for return on investment. What the curve tells us is that as investors perceive more risk for an investment, they will demand a higher return on investment to compensate them for risking their money and time. One thing that jumps out is that ROI on this chart is considerably higher than what one could achieve in the stock market, the bond market or real estate. Ownership of privately-owned small to middle-market businesses is much more risky than most other investments. Publicly traded stocks and bonds are highly liquid, that is they can be sold on the public market almost instantaneously. Real estate, while less liquid, has historically been more stable in value. Small business is risky for a number of reasons. One, because it is illiquid, selling can take much longer and cost much more than selling stock or real estate.

Summary

To summarize, the Earnings approach states that the value of a company’s assets can be estimated by looking at the cash flows generated by those assets.

To measure cash flows, we would adjust reported net income for non-cash items, for expenses at the owner’s discretion, and for expenses related to the company’s form of organization and capital structure.

Since a prospective buyer is really buying future cash flows, we evaluate the risk that that current cash flows are not representative of future cash flows and calculate fair market value to compensate for perceived risk.

I hope this has been informative.  In the next installment, we’ll cover the concept of present value and discounted cash flow analysis, another way to apply the earnings approach.   Later, we’ll cover financial statement analysis.  Then we’ll put it all together with a valuation analysis of an example company.

Cypress Business Partners offers a free estimate of the value of your business.  Please let us know how we can be of service to you.   Visit us on the web, or on Facebook.   If you would like to be informed when the next presentation is available, please send me your email address.  I promise to respect your privacy and will never share your information with anyone.